Robotics Microcontroller PCB (WIP)
In high school, I competed in Science Olympiad, with one of the events I competed being Robot Tour. We scrapped together a build using an Arduino and some motor drivers, and 3D-printed a chassis and wheels. Unfortunately, the motors' Hall-effect encoders we used for distance measurement wasn't very accurate. Additionally, the IMU (accelerometer + gyro + magnetometer) we used was a pain to connect up, and it was very easy to pull out a pin by accident. Suffice to say, we did not do well. As a result, now in university, I wanted to apply what I had learned about PCB design and microcontrollers to make a more robust robot controller board. This has become my perennial project, and I'm always finding ways to upgrade it. As with any long-term project, scope creep has become a major issue. Every time I learn something new, either online or in class, I want to add it to the board. This thing has gone through so many redesigns I've lost count. The good news is that I got very good at soldering.
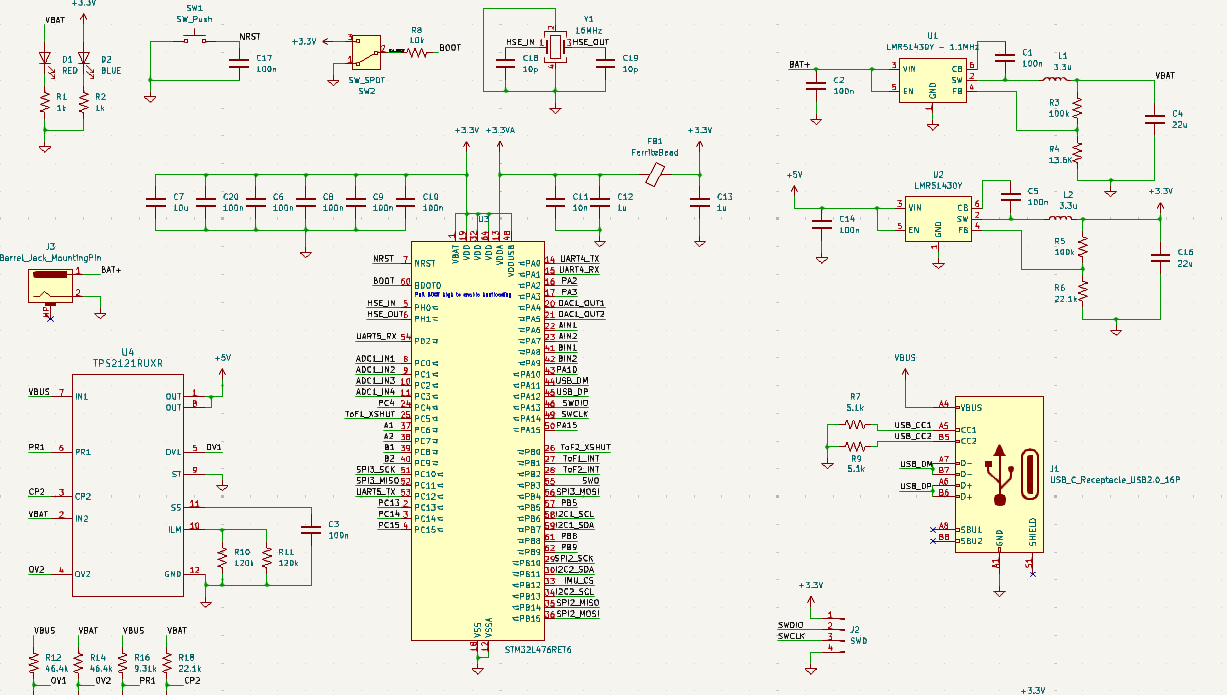
This board features an STM32L microcontroller as the brain, with a motor driver IC capable of driving two DC motors. There's also an IMU for orientation sensing, two headers for connections to time-of-flight sensors, and a few other miscellaneous components. The board is powered by 6 AA batteries (9V total, as per the SciOly event specifications, though it also has a USB-C connection and I'm thinking of adding LiPo comptability), with buck converters to step down the voltage as needed. The USB is the primary connection used for programming and debug. Below, I've included part of the KiCAD schematic of the latest iteration of the board.
MRI signal processing

My linear signals + systems professor does MRI research and had us get MRIs of our wrists, providing us the raw data. He had explained that the actual MRI signal was the Fourier transform of the spatial data, and that we had to take the inverse to reconstruct it. The GIF on the left shows the reconstructed slices. I also did some other processing on the data for fun.
Here's a demonstration of a cool phenomenon. When I undersample in the k-space (frequency domain), I start with a blurry mess, but as I increase the sampling rate, I get something that resembles my wrist. However, you might notice that in the intermediate stages, there is a ringing artifact around sharp changes in intensity (like the edges of the bones). This is called Gibbs ringing, and occurs with all discontinuities when approximated with a Fourier series.
FPGA Timer/Stopwatch
A fairly straightforward Verilog implementation of a 4-function timer/stopwatch (count up/down from 00.00/99.99 or up/down from a preset time) using a state machine and RTL design.
Game console
Why was this filmed diagonally? I don't know. Anyway, this was a PCB I made as part of a class competition for a handheld game console using a microcontroller.
The PCB was a simple 2-layer designed in KiCAD and manufactured through JLCPCB. There's a ground plane plus some rudimentary electrical isolation for the analog components (DAC + amplifier for the speaker and the potentiometer to ADC connection). The board sits on top of a TI-MSPM0. It features a 1.8" TFT display (interfaced through SPI), a few buttons + joystick for input, and a speaker for sound output. For this specific demo, I programmed Snake in C/C++ and ARM assembly, but I made the firmware quite flexible so that other games could be added easily. A 3D-printed enclosure was planned but never built.
Buck converter test board
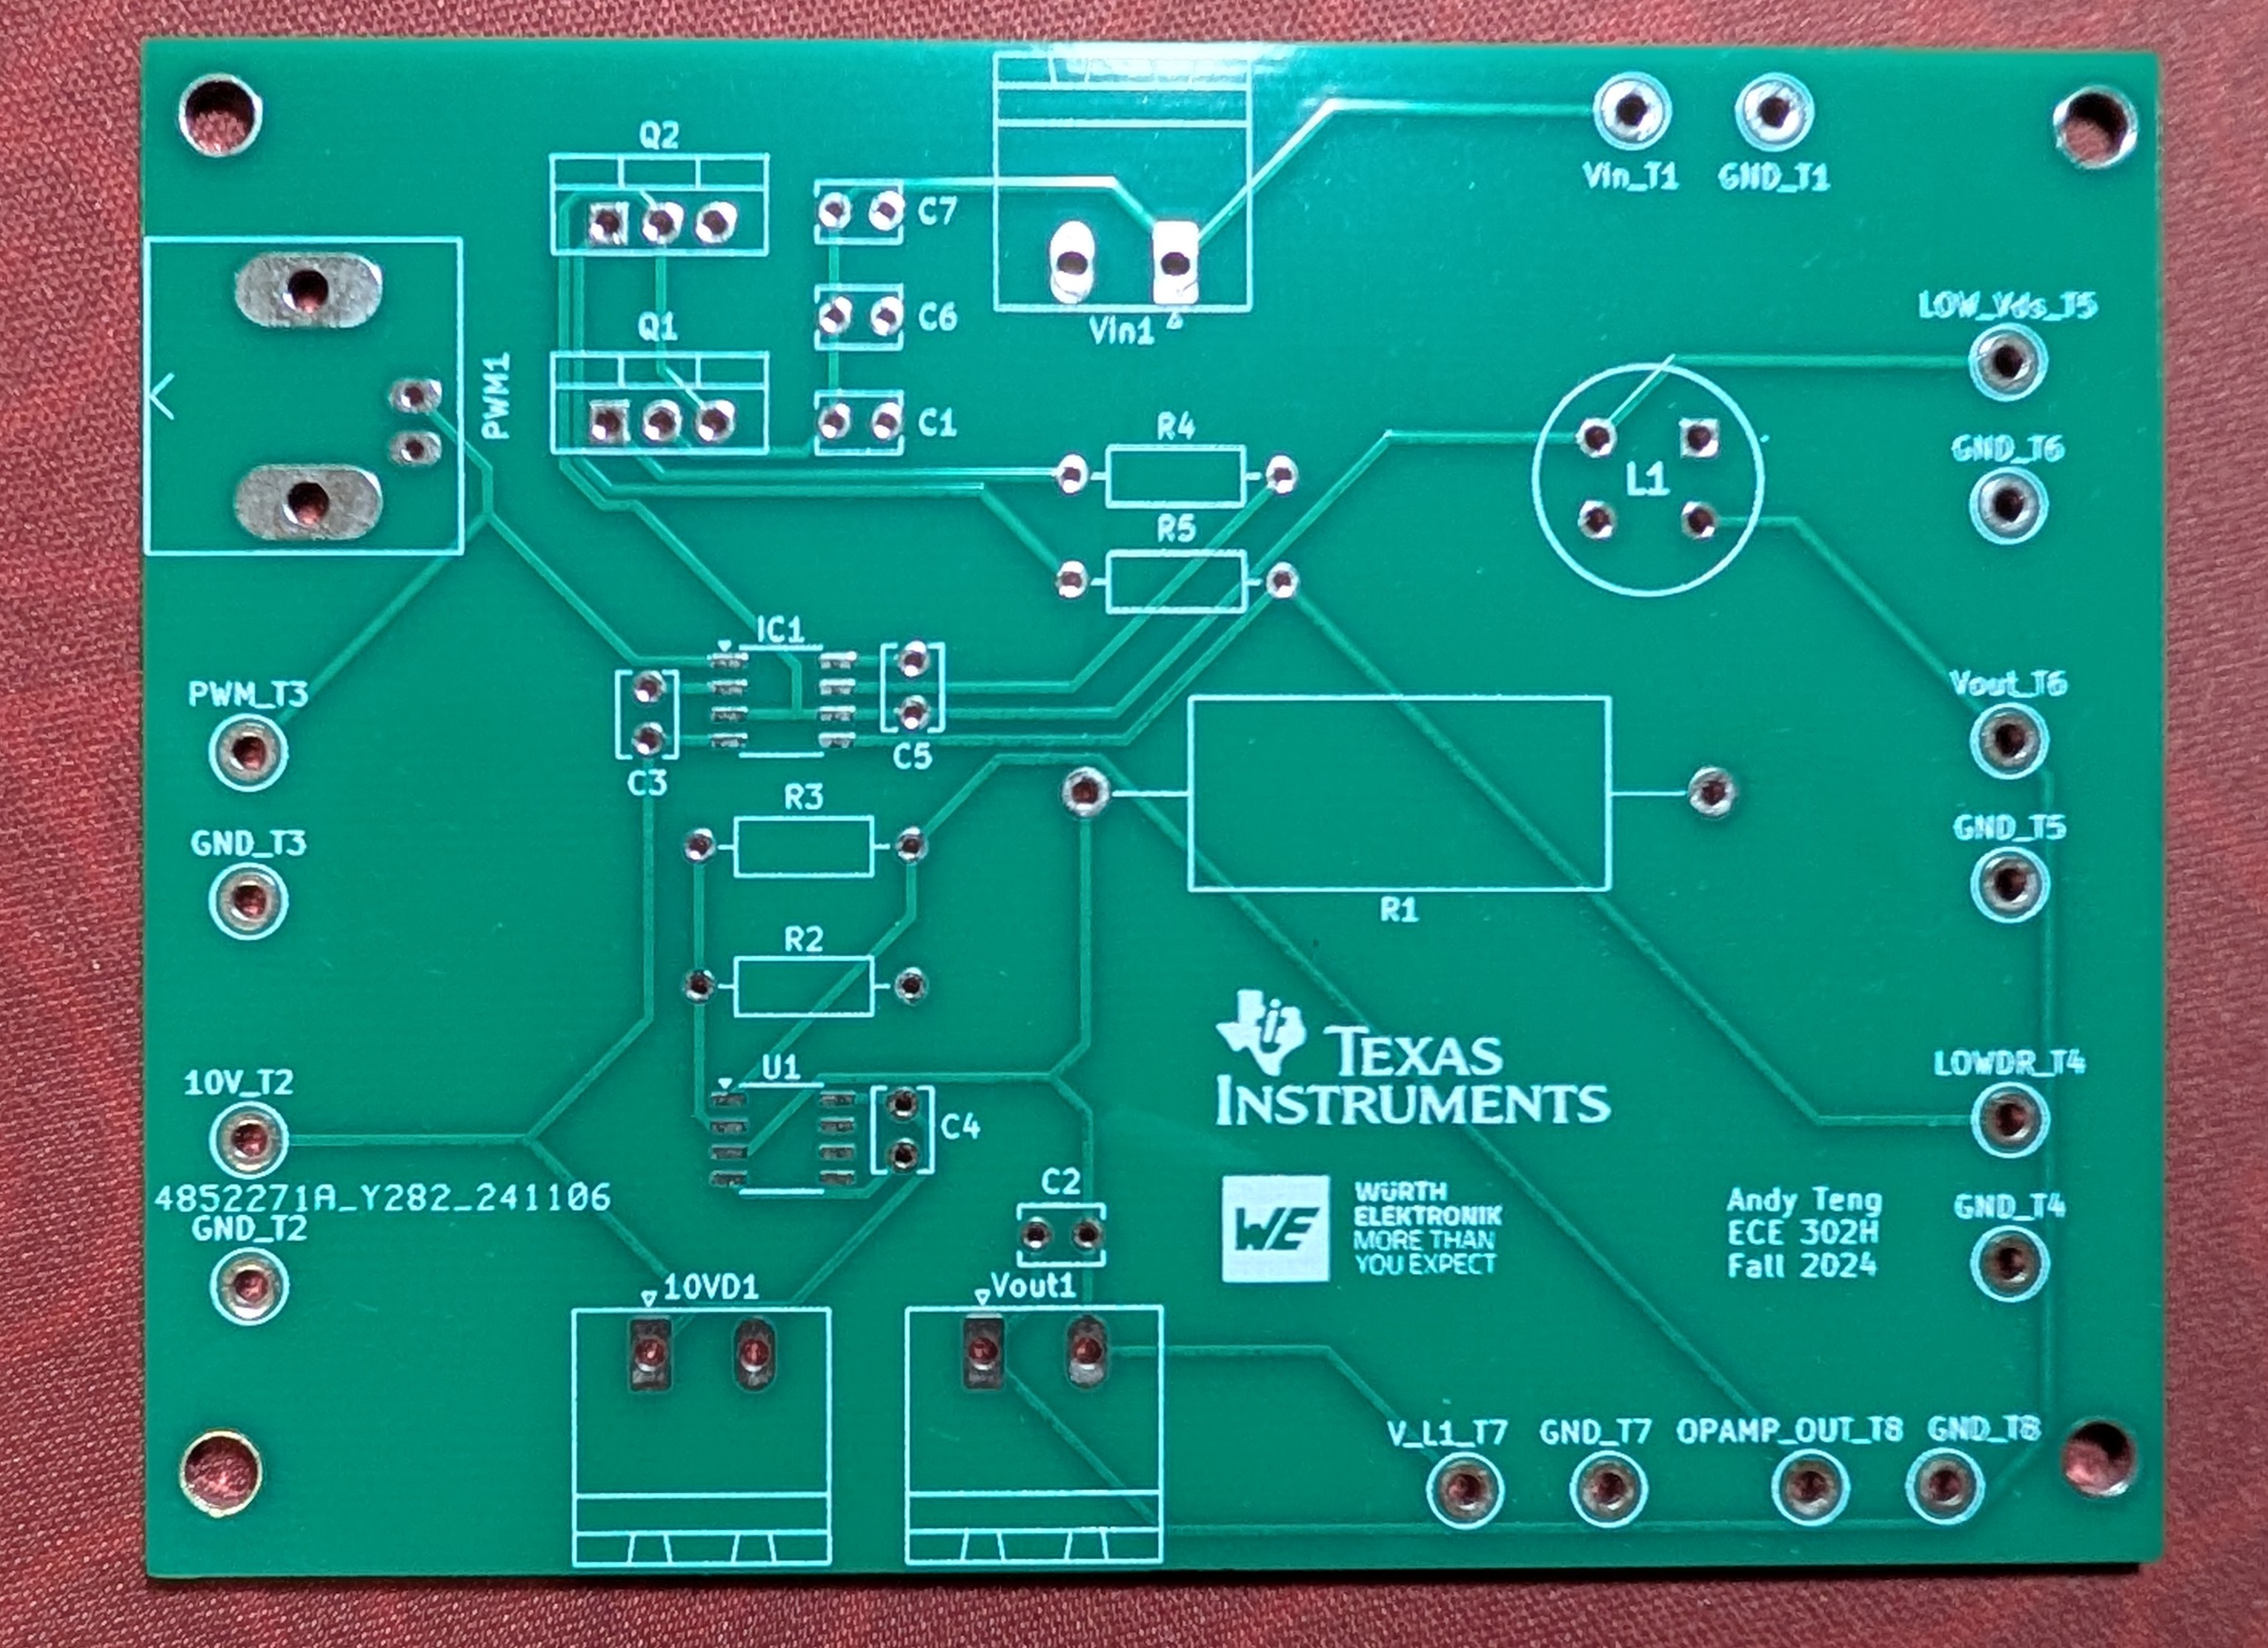
Unfortunately, I don't know where my completed PCB went and I don't have any pictures of it finished. Here's a spare one that I had lying around. I think this was the second PCB I'd ever made, and I've come a long way since. The design featured a half-bridge gate driver IC and two MOSFETs as the switching components of the buck converter. The input was driven through a coax cable into an op-amp before being stepped down by the converter.
Astronomy research
This was my first research experience ever, and I did it entirely independently. The goal was to analyze an open source TESS database and classify their light curves. There was a fair bit of signal processing and data science in Python, and I won't go into the details here. I did end up getting published in a journal called The Young Researcher. You can find a PDF copy of the paper here. Below is an example light curve of a previously known exoplanet as well as an eclipsing binary that I discovered.
 Exoplanet
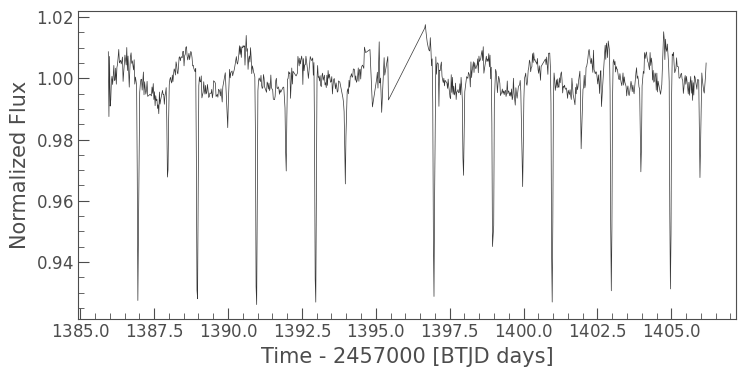 Eclipsing binary